Note · 26 October 2026
How to convert a satellite queue length reading into an estimated wait time
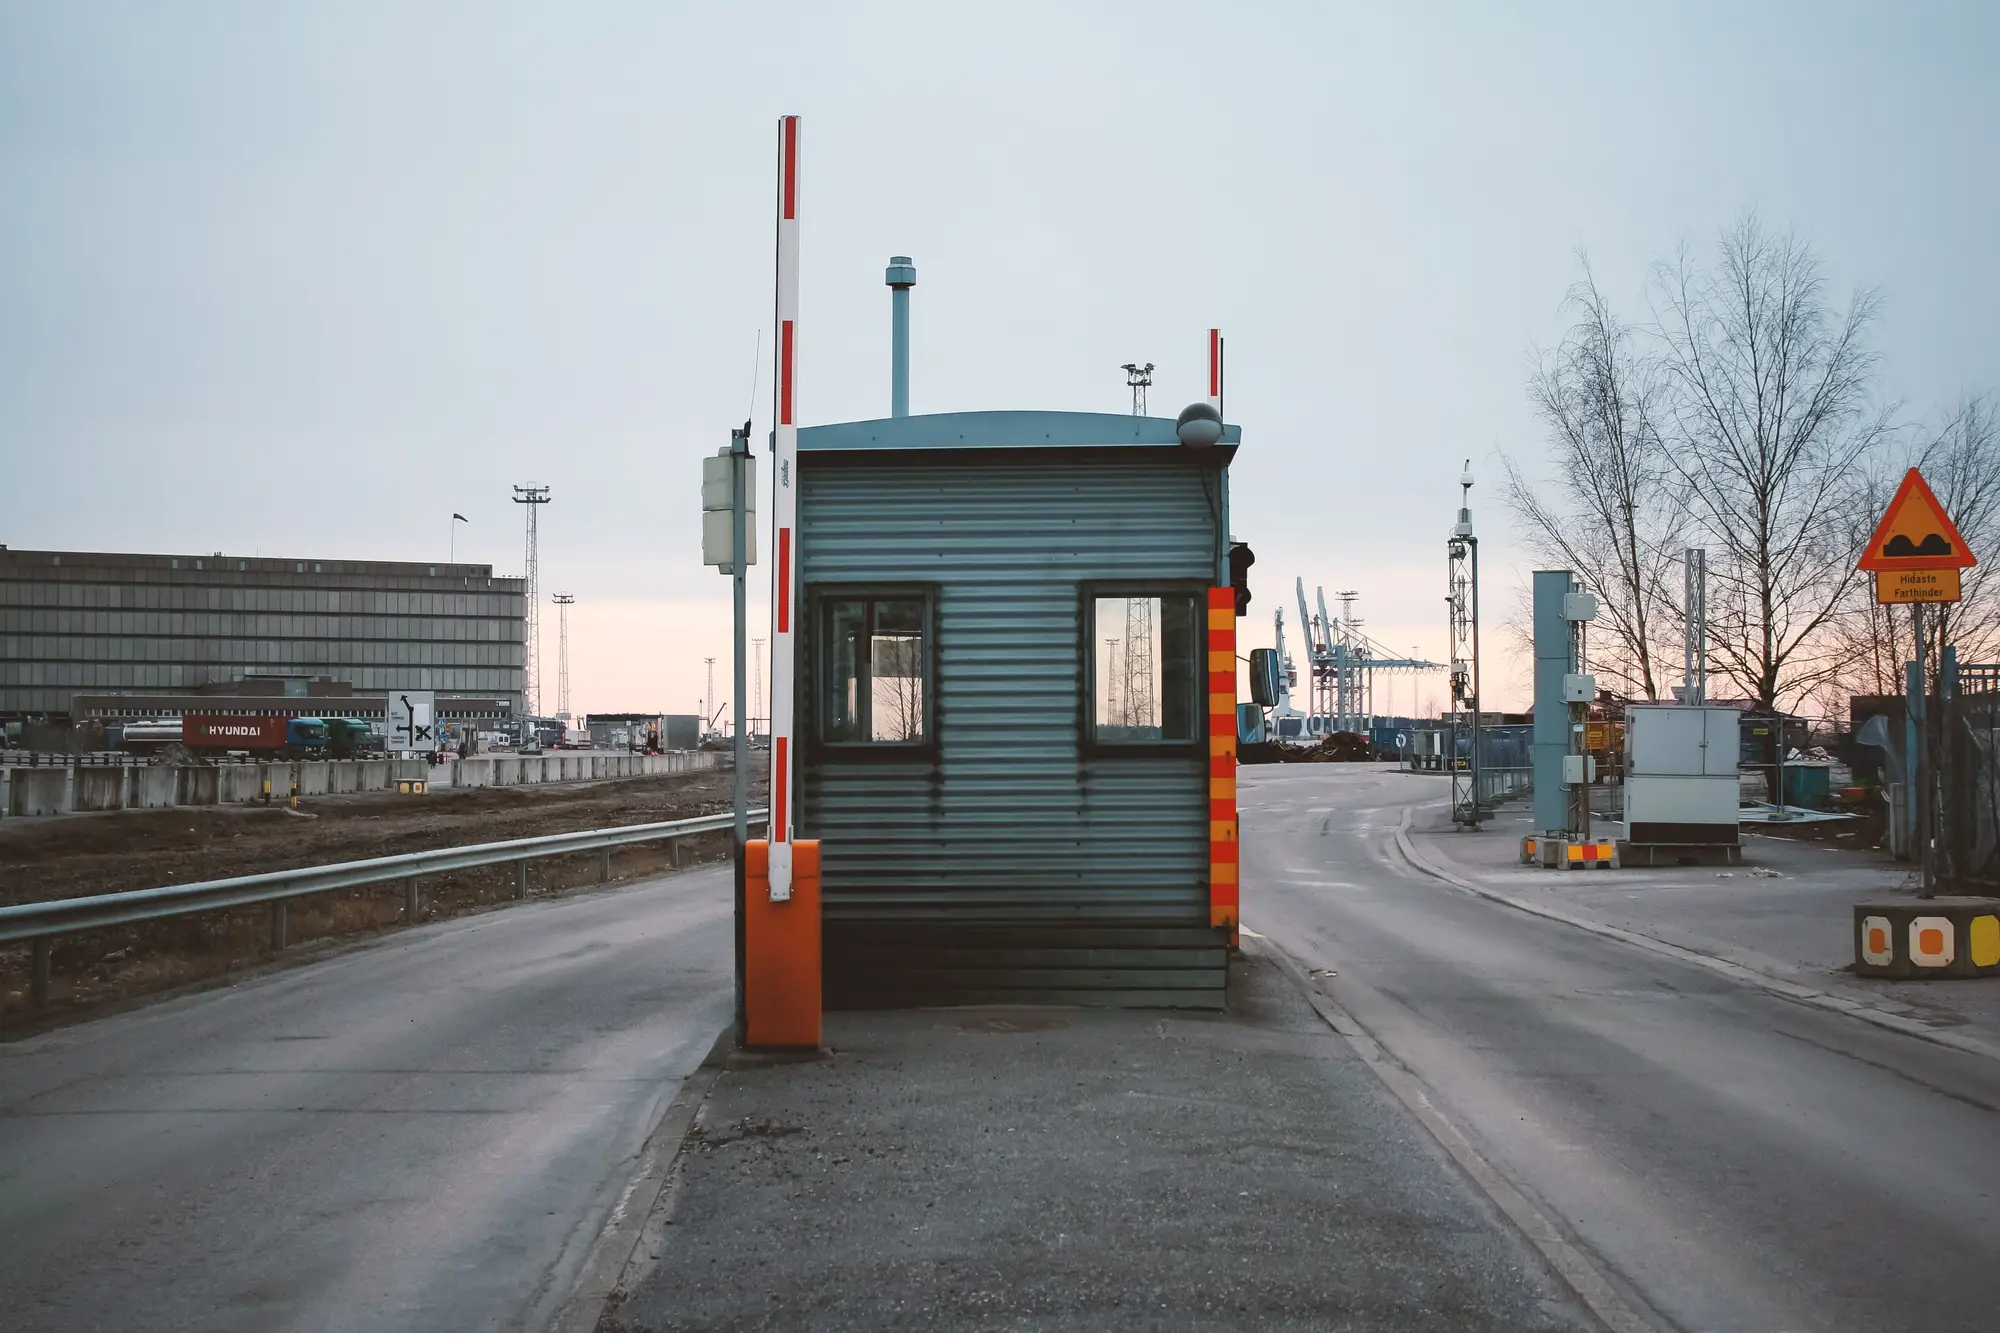
A satellite pass tells you one thing directly: how far the line stretches back from the gate. It does not tell you how long a trucker at the back of that line will sit before clearing primary inspection. Getting from one to the other takes two more numbers, and neither of them comes from the image.
The two numbers queue length alone can't give you
Queue length is a distance. Wait time is a duration. To bridge them you need:
- Average vehicle spacing in that queue, so you can turn meters into a vehicle count.
- A processing rate at the gate, so you can turn a vehicle count into minutes.
Skip either step and you're just eyeballing it. A 1.2 km queue could mean 90 minutes or four hours depending on how many lanes are open and whether it's commercial trucks or passenger vehicles backed up.
Average vehicle spacing in a queue
Spacing isn't fixed, and it isn't random either. It tracks a few things a planner already knows from the yard:
- Vehicle type. A line of passenger cars idling bumper to bumper runs somewhere around 6 to 8 meters per vehicle including the gap. Commercial trucks, especially loaded trailers, run closer to 18 to 22 meters per vehicle.
- Queue state. A fully stopped, idle queue packs tighter than one that's crawling forward in short bursts. Crawling queues often show more gap per vehicle because drivers leave room to react rather than riding the bumper ahead.
- Lane discipline. Single-file queues on an access road read differently than a multi-lane marshaling yard where vehicles stage two or three wide before merging to the booths.
For a mixed queue, most planners just use a blended figure, weighting toward whatever vehicle type dominates that crossing. If a terminal runs 80% commercial traffic, you lean on the truck spacing number and treat the passenger vehicles as a rounding error.
Divide your measured queue length by the spacing figure and you get an estimated vehicle count. A 900-meter queue of commercial trucks at roughly 20 meters each works out to around 45 vehicles in line.
Queue length to wait time: the second conversion
Vehicle count alone still isn't wait time. You need a processing rate: how many vehicles per hour actually clear the gate. That number lives in gate operations data, not in the image, and it moves with:
- Number of booths or lanes staffed
- Inspection type (routine versus secondary referral rate)
- Shift changes and known slowdowns
If the crossing is clearing 20 trucks an hour through two open lanes, that 45-vehicle backlog translates to roughly two and a quarter hours from the back of the line to the booth. Add or pull a lane and the number moves accordingly, which is exactly why the vehicle count from the image matters more than the raw distance. Two queues of the same length can carry very different wait times if one is trucks and the other is cars.
Where this estimate breaks down
This conversion is a planning tool, not a promise. It assumes spacing holds steady along the whole queue, which it rarely does near curves, checkpoints, or where a queue splits into lanes. It also assumes the processing rate you're using is current. A staffing change an hour after the image was captured will throw the estimate off, and nothing in a still image tells you that happened.
That's the gap a same-day read is built to narrow. A fresh pass gives you the current queue length and a marked-up image showing exactly where you measured from, so the vehicle count going into your wait-time math is based on what's happening now, not what a sensor logged yesterday or what a driver radioed in an hour ago. You still apply your own spacing and processing figures, but you're applying them to a current number instead of a stale one.
If your crossing has no ground sensor and you're stuck estimating queue length from driver reports or yesterday's count, Queue Length Monitor delivers a dated briefing note with the measured distance and the image it came from, so your wait-time math starts from something current.